Marginal wins was a statistic popularized by the late Doug Pappas and furthered by Baseball Prospectus that helped put a dollar amount on just how much a major league baseball team pays per win. Marginal wins started by figuring out the lowest possible price by which a major league team could be fielded (the league minimum salary x 25, plus some money for DL expenses, filling out the 40 man roster, etc.) and then assuming that such a team would win about 30% of it’s games, since no MLB team would go 0-162.
Every win over that 30% mark is then a marginal win, and the formula Pappas used can tell you just how much a team spent for each additional win. Ideally, teams will spend very little money per marginal win, giving them payroll flexibility, and demonstrating the ability to win with fewer resources. You also get the fun of seeing teams with the most bloated, ineffective payrolls, paying massive amounts of money for middling success. Some teams spend huge amounts, make poor and expensive roster mistakes, and finish much worse than more clever teams that can’t afford to spend as much.
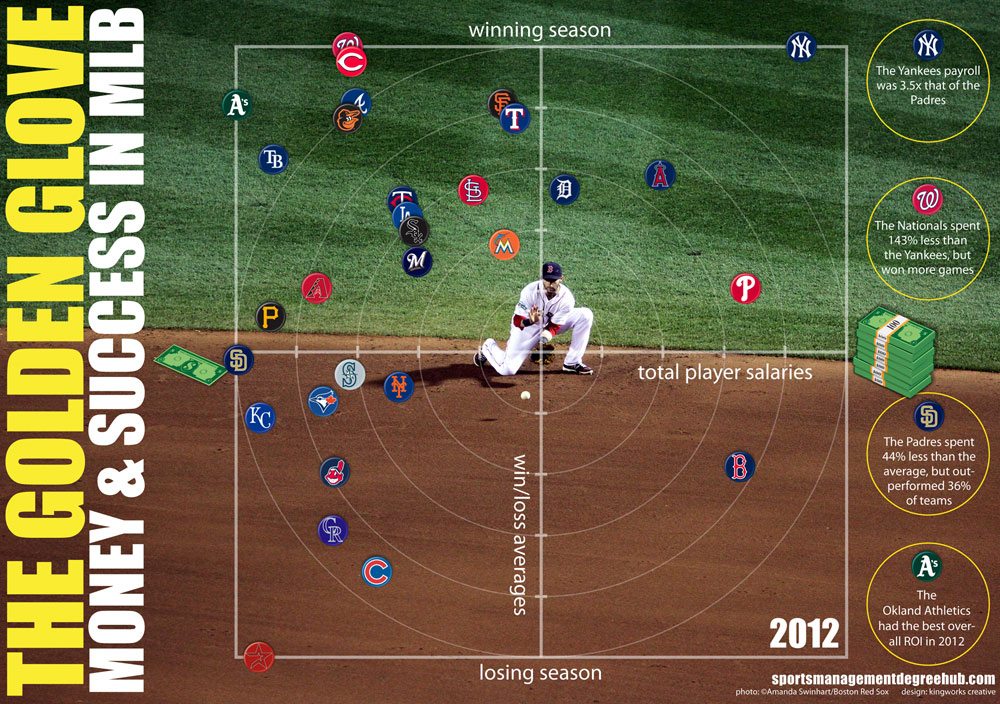
In this infographic, you can see the teams that got the most bang for their buck, that spend the least for each marginal win, largely in the upper left quadrant. The Washington Nationals and Cincinnati Reds won 98 and 97 games respectively, while spending well under $100 million. Not surprisingly, the Oakland Athletics, of Moneyball fame, are squarely in this quadrant as well, having won 94 games with a miniscule payroll.
The teams in the lower left quadrant are teams often in rebuilding mode. They have low payrolls and disappointing results, but ideally they are clearing the books and building talent for future seasons. Unfortunately for their fans, you will also see franchises that don’t seem to care much about winning in this quadrant, as some of these teams have low payrolls and ineffective, uncaring management.
Teams in the upper right are the large market teams that have success but pay through the nose for it. The New York Yankees are the classic example here, winning 95 games in 2012, but spending $200 million+.
It’s a rarity to see teams in the lower right quadrant. It’s hard to spend huge amounts in Major League Baseball and not finish at least .500, but in 2012 the Boston Red Sox managed to be such a team, winning only 69 games with one of the most expensive rosters in all of baseball.